GO Reference Genome Meeting Metric Plan
Jump to navigation
Jump to search
Phase 1. Data collection and analysis for internal use by GOC.
Begin September 2007 Completion March 08. Begin to collate data produced by the RG group. Create pipeline to produce monthly updates to data. View results via static web pages.
Current stats: Media:annot-stats.doc Derived from: Media:annot-stats-no-root.xls
Data Collection:
- General annotation data : gene_association files / GO DB
- Reference Genome info : curator files/database?
- Sequence: GFF3 from MODS where available. GTF2GFF3 conversion coming from SO software group. Standardization process for the RG GFF3 files planned.
- GO term tracker: How many requests/terms generated from ref genome community. Interface to the sf tracker ORB.
- Simple Figures:
- How many genes in the genome?
- How many genes can be located?
- What kind of genes (protein coding or ncRNA)
- Number of genes curated per genome. (RG and GO)
- Division of gene annotations based on evidence code.
- How many new GO terms have arisen from this project?
- Distributions and averages:
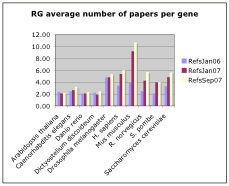
- How many papers per gene?
- How many papers per annotation?
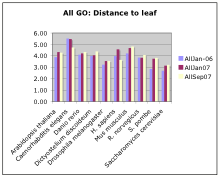
- How deep is each annotation (Granularity)?
- How much evidence is there per annotation?
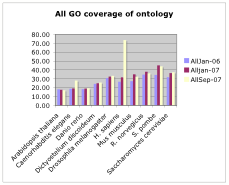
- How much coverage of the ontology is there per genome?
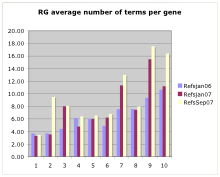
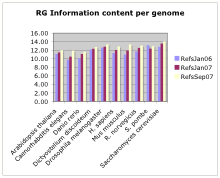
- How much information is in the annotation?
- Orthology:
- How many ortholog sets have been annotated across the board?
Phase 2 Dynamic data presentation
Improvement to data collection processes, dynamic and graphical data presentation. Begin Spring 2008
Data collection:
- General annotation data : GO DB. Can be generated eg from GOOSE
- Transition from flat files to ref genome database.
- GOC will host sequence files for each genome. These GFF3 files will be standardized.
- RG SF tracker info.
Audience: GOC and Wider scientific community.
- Depth of annotation:
- Use the RG curator driven paper counts and assertions of completeness to learn more about how many papers it takes to make a complete annotation.
- How many papers have been considered for GO curation ?
- How many papers provided GO terms ?
- How many genes which have papers associated are considered complete/comprehensive ?
Presentation of data: A searchable interface with graphical views of data. Use of canned queries to provide means to interrogate the data.
